It's important to get familiar with the "Using Juice" documentation on this site to understand not only the tool but also the context of the data in Juice. Before you start generating reports, we recommend you read the FAQs below (and the information in the "Using Juice" section) so you are able to extract accurate information from the app.
Juice is ResearchUVA’s Sponsored Programs Dashboard application. The Juice app is a data analytics and visualization platform, developed to give us up-to-date insight and facilitate data-driven decision-making in UVA’s research enterprise. Juice replaces the Excel file of historic Office of Sponsored Programs (OSP) data that was available for download on the OSP website.
We created the dashboard in collaboration with a company called Juice Analytics (http://www.juiceanalytics.com/) and the Juice name has stuck! Sometimes you’ll hear people use “Juice” and the ResearchUVA “Sponsored Programs Dashboard” interchangeably. It’s the same thing.
There are two different applications in Juice - UVA Sponsored Programs Dashboard, which is meant to show the most up to date information and is updated daily; UVA BOV Quarterly Report, which shows static information that reflects quarterly, and year-end information that has been reported to the University Board of Visitors. To toggle between these two applications, use the “My Apps” button located beside the username in the top right corner.
Also, note there are two stacks in the UVA Sponsored Programs application, one for Trend Analysis and one for Detail Analysis.
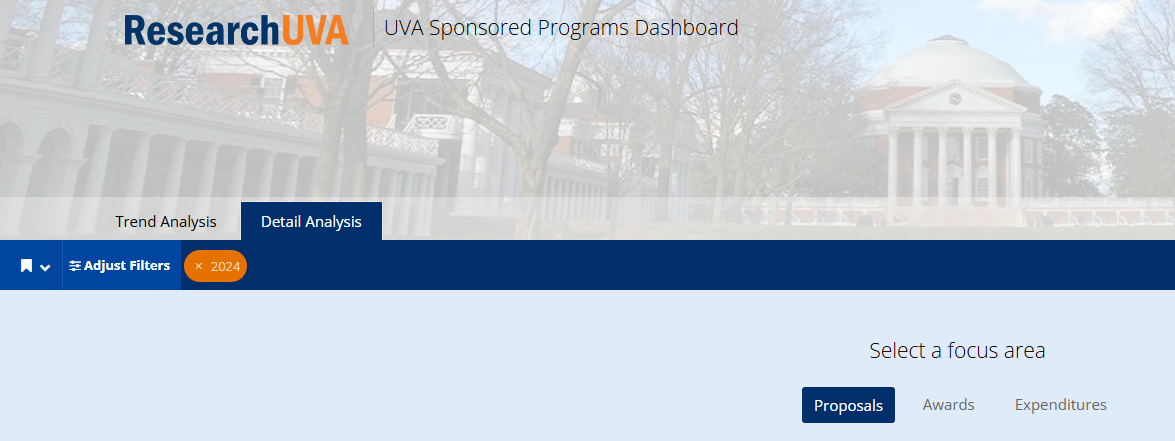
We update the Sponsored Programs Dashboard every morning. The date on which data was last updated in Juice will appear at the top right. Expenditures will appear 1-2 days after posting in Workday.
DISCLAIMER: In collaboration with Schools and units, OSP continues to strive towards obtaining accurate and complete proposal information. In this regard, we have completed a couple of iterations partnering with schools to clean and vet FY17 proposal data. We believe proposal data as it currently looks is a close approximation of reality. We recently launched the ePRF for online proposal routing, which will also greatly improve proposal data quality. OSP will be also be revisiting methodology in FY18 in order to continue to ensure this data is predictable and to move toward industry standards.
This is a trend chart which shows the number of Proposals submitted each month. The month where this data is depicted on Trend Analysis is based on the Proposal Signature Date.
All the ePRFs go through a formal “closeout” process at OSP to ensure standard data quality. A proposal will not show up on Juice until it has been closed out by OSP.
The following table shows the statuses and categories of proposals used in the calculations presented in Juice FYR23 and after, uses the Sponsor Submission Date to determine Fiscal Year:
Types that count as Proposals | Proposal Statuses that contribute to the count | Proposal Statuses that are not counted |
|---|---|---|
Funding Proposal | Pending Sponsor Review Sponsor Awarded Awarded Award Notification Received JIT Response Required Sponsor Awarded Awaiting Budget Review Submitted to Industry Sponsor Pending Sponsor Review Award Anticipated Not Funded (old declined) Withdrawn from Sponsor | Draft Department Review Department Review: Response Pending from PI Specialist Review Specialist Review: Pending changes by PI Pending Submission to Sponsor Awaiting response from Federal Sponsor Changes requested by Contract Specialist Awaiting Submission to Federal Sponsor Approved Not Submitted (old Abandoned) SPO Status Confirmation Component Final |
The following table shows the statuses and categories of proposals used in the calculations presented in Juice for FYR22 and prior:
Types that count as Proposals | Proposal Statuses that contributes to the count | Types that do not count as Proposals | Proposal Statuses that aren’t counted |
|---|---|---|---|
New | Accepted | Letter of intent/Pre-Proposal | Void |
Renewal | Declined | Noncompeting Continuation ** | Abandoned* |
Resubmission | Pending |
|
|
Supplement | Rejected |
|
|
| Withdrawn |
|
|
At the beginning of FY17, we made changes to the way we capture and report data. Beginning FY17, the entire amount of a multiyear proposal submitted is counted. Prior to this, only the first year of a multiyear proposal would be counted. Additionally, as part of the new methodology, all incremental funding is recorded on the original proposal record. Because of these changes, you will see a big jump in Proposal Dollars between FY16 and FY17 and a reduction in proposal count.
Example: For FY17 and forward, if a PI submits a proposal for a three-year project worth $3M. The Proposal Count is one and the Proposal Dollars are $3M for FY17.
*This Abandoned is a proposal status and is different than the ePRF abandon functionality.
** The way noncompeting continuations have been treated has changed over the years as explained below. The current methodology FY18 and forward follows industry standards and will enable us to accurately report on our proposal activity.
The 3 timeframes and how the noncompeting continuations were/are handled are as follows:
- FY16 and prior ---- received a new proposal each year, thus inflating proposal count and only included the dollar amount for that particular year – in Year 2 counted 1 proposal for Year 2 and the amount budgeted for Year 2.
- FY17 ---- transition year, started including (catching up) for any remaining years. If in Year 3 for noncompeting continuation of a 5 year proposal, we included the amount budgeted for Year 3, Year 4 and Year 5 in the proposal dollars, but only counted as 1 proposal.
- FY18 ---- Noncompeting continuations will not count in proposal counts or dollars moving forward, as we are now counting the full proposal dollar amount in the fiscal year the proposal was submitted.
NOTE: In the process of cleaning historic data, if there were older proposals not included in prior years, but are being awarded FY17 or greater, we would show these now in JUICE.
The following table shows the statuses and categories of Awards used in the calculations presented in Juice FYR23 and after. Uses the Award Receipt Date to determine Fiscal Year:
Types that count as Awards | Award Statuses that contribute to the count | Award Statuses that are not counted |
|---|---|---|
Funding Award | Advance Account, authorized by Sponsor Active, authorized by Sponsor Completed (old Closed), authorized by Sponsor | Draft Designated Review Designated Review, Response Pending Final Review Final Review – Response Pending Designated Review Requested Pending Activation Advance Account, Not Authorized Active, Not authorized by Sponsor Completed, Not authorized by Sponsor Transferred Out Terminated Withdrawn |
The following table shows the statuses and categories of Award Mods used in the calculations presented in Juice FYR23 and after. Uses the Effective Date to determine Fiscal Year:
Types that count as Awards | Award Mod Statuses that contribute to the count | Award Mod Statuses that are not counted |
|---|---|---|
Funding Award Change (award mod) | Approved, authorized by Sponsor | Open Draft Approved, Not authorized by Sponsor Pending Approval Designated Review Final Review Designated Review Requested Final Review - Response Pending Designated Review – Response Pending Withdrawn (old Abandoned) |
The Award Count shows how many awards have received funding in a specific period. Award Dollars shows the respective sponsor funding authority received. The Monthly View of Awards shows the funding increments.
While the methodology of using actuals (sponsor authority received) has remained consistent from FY12 through present, there has been variability in the rules used for assigning awards to a specified fiscal year.
- Between FY12-FY16: awards were mostly assigned using the authorized budget start date, however, case-by-case judgments were also made to ignore the budget start date.
- FY17: same philosophy as previous fiscal years, however, many awards were included in this year if they allowed pre-award spending in fiscal year 2017.
- FY18 – this year, there was agreement from School and OSP leadership, to move to the industry standard for counting award dollars, which is any award received at OSP by the end of June that is ready for account setup will be processed for inclusion in FY18, regardless of the budget start date.
The new methodology, will ensure consistent treatment and counting of awards, enable OSP to provide award data more rapidly, and ensures that there is common understanding in how fiscal years numbers are derived. It further offers an ability to accurately compare (apples to apples) and see the state of research growth over time.
Example: A PI’s proposed three-year project worth $3M is accepted. The project receives funding authority for $800,000 and then another one for $200,000 during the first year.
The Award Funding Increments increase each time an award receives award funding authority. Therefore, at the end of Year 1, the Award Dollars will be $1M, the Award Funding Increments will be two, but the Award Count will still be one. 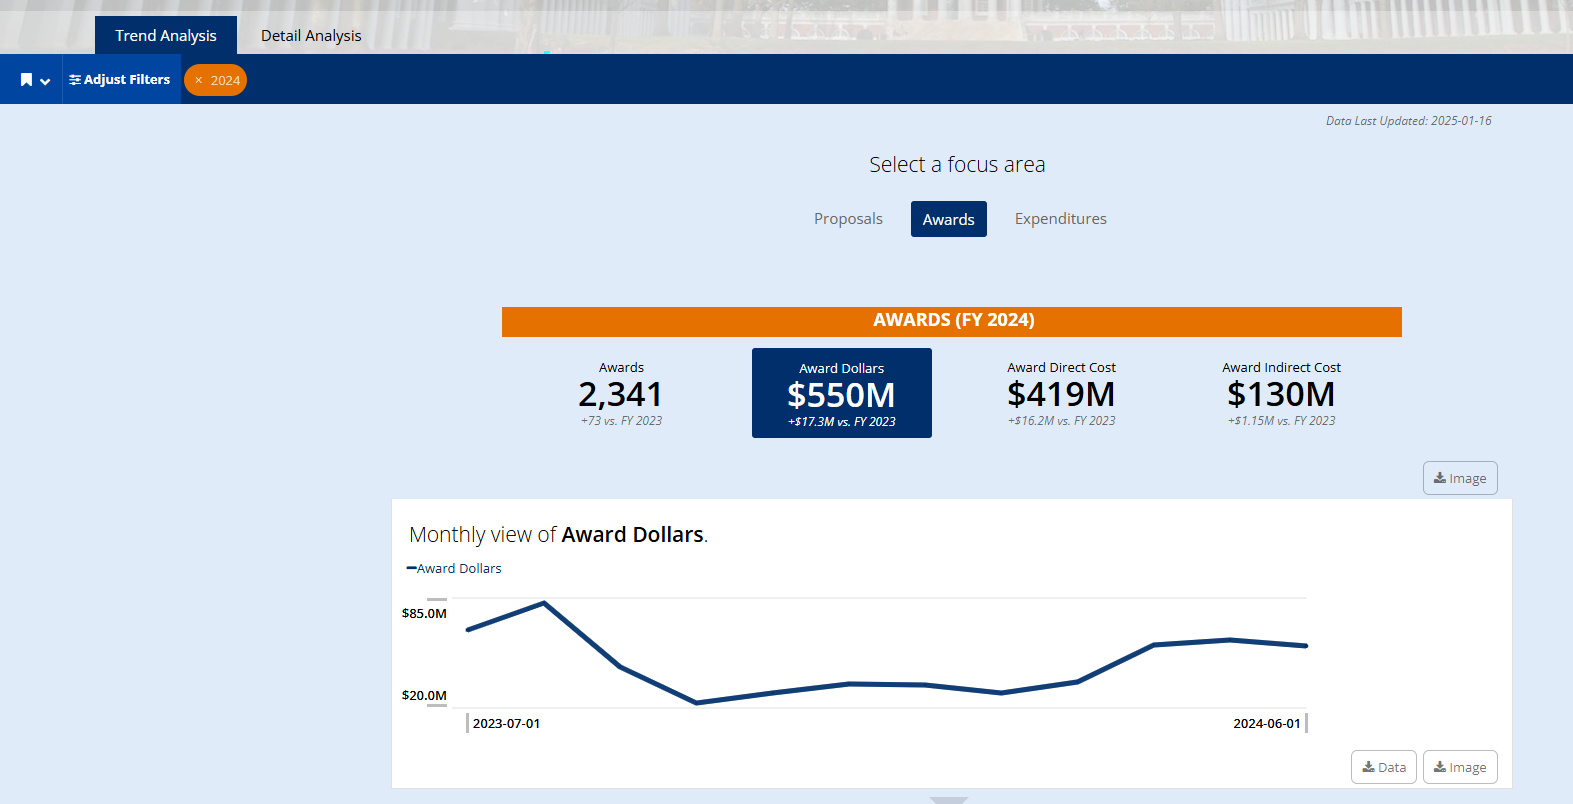
NOTE: In the process of cleaning historic data, we found that $0 awards were included in the award counts prior to FY17. We took the opportunity to take out the $0 awards from the counts. Therefore, the award counts for FY16 or older may be slightly different from what was reported to the BOV in those past years.
Any sponsored program expense that was posted in the date range selected in the filters will show up in Expenditure Dollars. The monthly view is based on GLDate (or Transferred Date in some terminologies). We chose this date to be consistent with the way other accounts management systems (UBI) record expenditures.
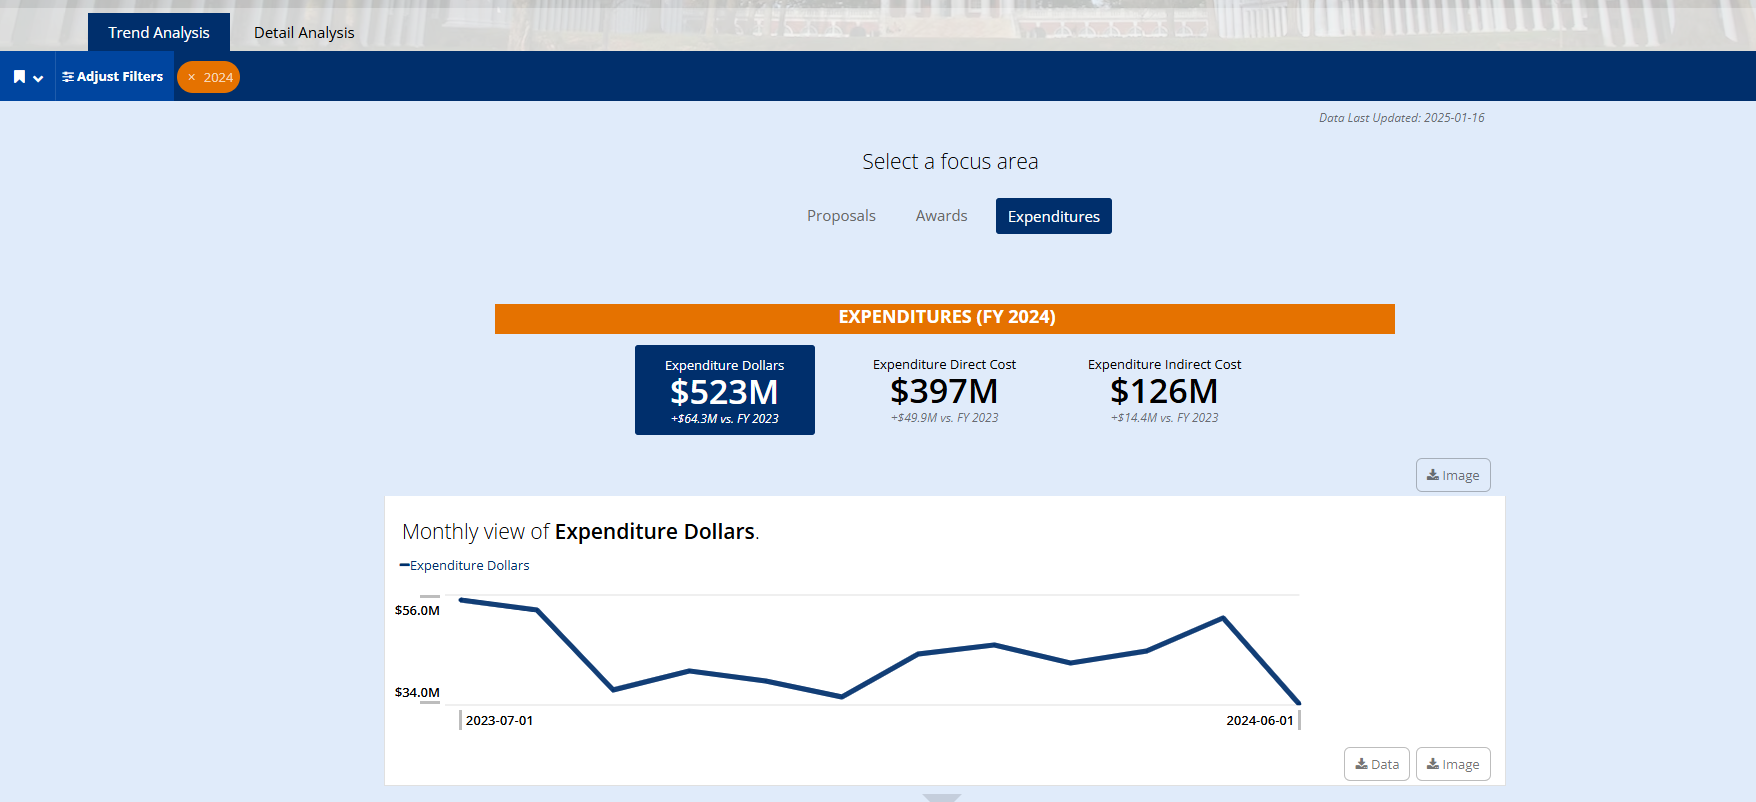
The expenditures displayed are the ones posted in the date range shown at the top.
Criteria used for Workday Expenditures in JUICE (Fiscal Year 2023 and forward):
- Spend Category is not blank
- Ledger Type = 'Actuals'
- Ledger Account Type = 'Expense'
- Expense Book = 'Common Reporting Book'
- Accounting Date is used to determine Fiscal Year
- Expense Funds should have hierarchy of 'FDH086 Sponsored Research Funds'
- Award Purpose Code != 'Financial Aid' (Expenses of Financial Aid awards are not counted in JUICE)
Some of our Proposal and Awards may have two Sponsors. The Immediate Sponsor is the one that gives us the money directly and the party with whom we have the legal binding agreement. The Originating Sponsor is the originating source of funds. For example, a Federal Sponsor like the NIH could be the Originating Sponsor for a project we are working on with the University of Pennsylvania (the Immediate Sponsor).
We are working to make it easier for people to understand our sources of funding. One way we are doing this is ensuring we have captured detailed information about the nature of our sponsors. Classification is the highest level of definition for sponsor, and includes: Federal Government, Foreign Entity, Foundation, Industry, Local Government, Other Colleges & Universities, and State Government.
Sometimes we need to break down Classifications further, into Categories. For example, Federal needs to be broken down into departments, including the Department of Defense (DOD), the Department of Health & Human Services (DHHS), the Department of Energy (DOE), etc.
Sub-categories allow us to break down the categories to provide deeper insight. For example, we can break down DOD into DOD – Army, DOD – Navy etc.
Organizations are the most granular unit represented in Juice, and Departments are composed of Organizations. The Organizations displayed on Juice represent the Organization that is responsible for the proposal, or award. This information is picked up directly from PRF/ePRF.
Departments are imported from the institutional spreadsheet maintained on the Integrated System’s website, which shows the Organizational Hierarchy maintained by the University. This can be found under “FINANCE LINKS” at http://its.virginia.edu/integratedsystem/
It is important to note that the Organization listed on Juice may not be part of the official hierarchical Organization where many of the investigators reside, therefore queries by Organization may not include some expected proposals/awards. For example, if the Beirne Carter Center is responsible for a proposal/award based on research on Immunology, the proposal/award Organization will be “40505 MD-BEIR Ctr/Beirne Carter” and not an Organization within the Immunology Department.
An easy way to look up Departments and Organizations is by typing a few letters on the filter search box. Another options is to see which Organizations are listed under a Department by selecting the Department of interest in the filters of Detail Analysis stack and selecting Organizations in the first visualization.
The number on the right end of each bar shows the number of Awards received by the Organization in this particular screenshot. Note that only the Organizations which have an award/proposal associated with them will show up on the visualization.
This stack is very useful for the purpose of viewing year over year comparisons, and trending.
The first line chart is based on your selection of time frame/fiscal year. Hovering over the line shows exact values. The following visualization helps you see a side by side comparison over a few Fiscal years. There are various options to select the data you want to view.
This stack is useful for detailed analysis. The horizontal bar charts show cumulative rankings by Sponsor, Sponsor Classifications, Schools, and Investigators and so on. This stack provides great analysis opportunities with filter selections, and the details table at the bottom provides a peek into data at granular level. The table can be used to answer a question like: “what/who are the top 10 _____ of FY2017?”
In the details table, each row has unique, related data, but this does not mean that each row represents a unique award, proposal, or PI. This data is transactional, and additional grouping/sub-totaling may be required as per user’s judgement.
Effective 05/18/18, the details table download offers additional fields not available in the web interface.
The new direct and indirect dollar fields are available for all years. The computing ID, start date, end date, contract ID, and award purpose code fields were added in FY18 data and will be available moving forward, but will not be available prior to FY18.
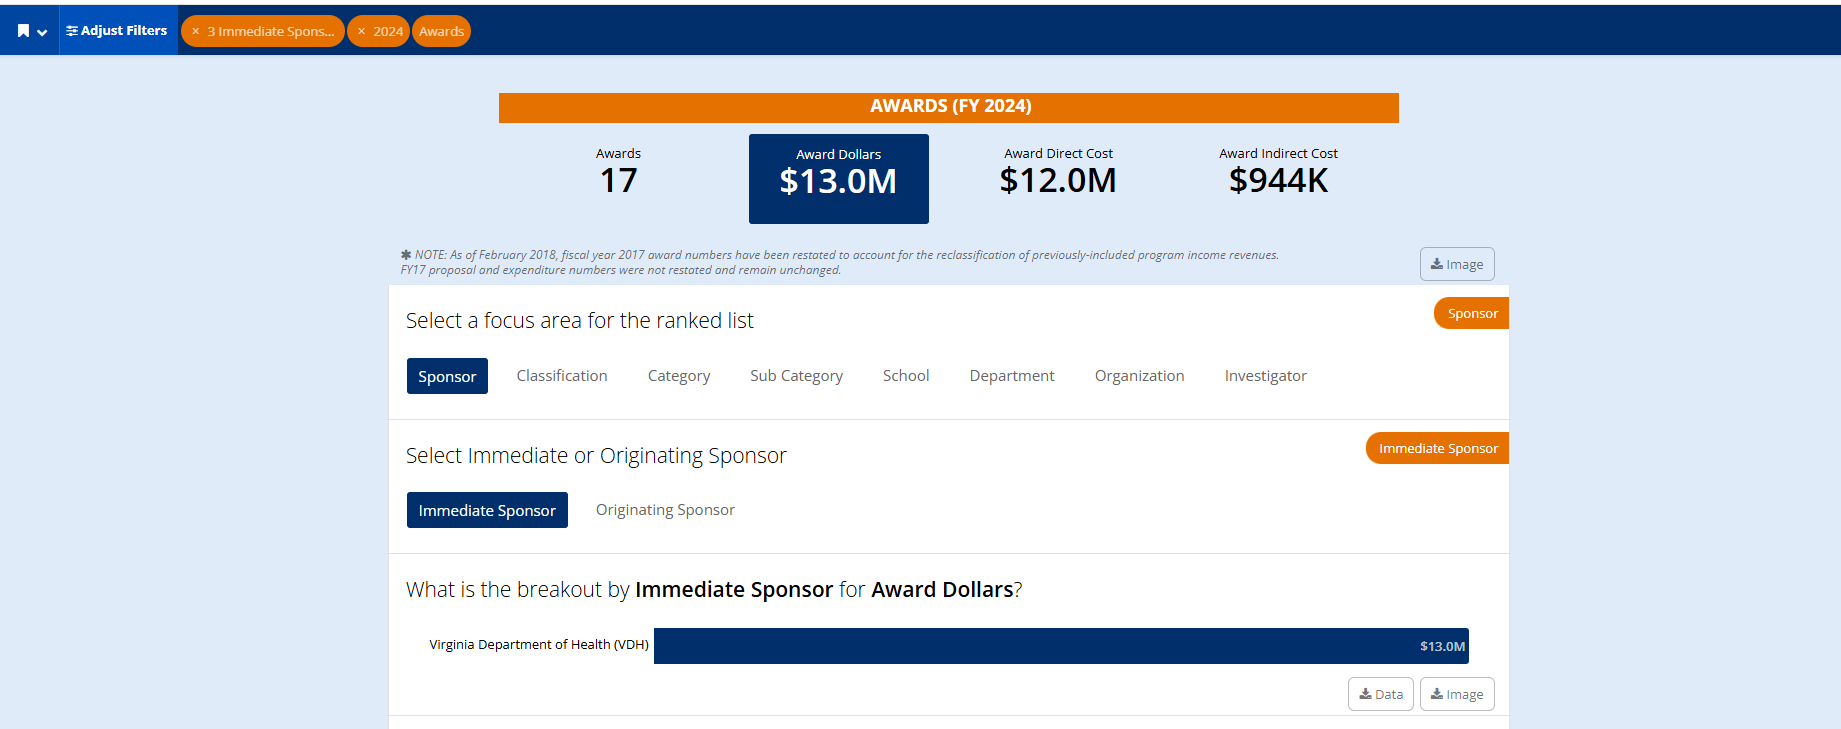
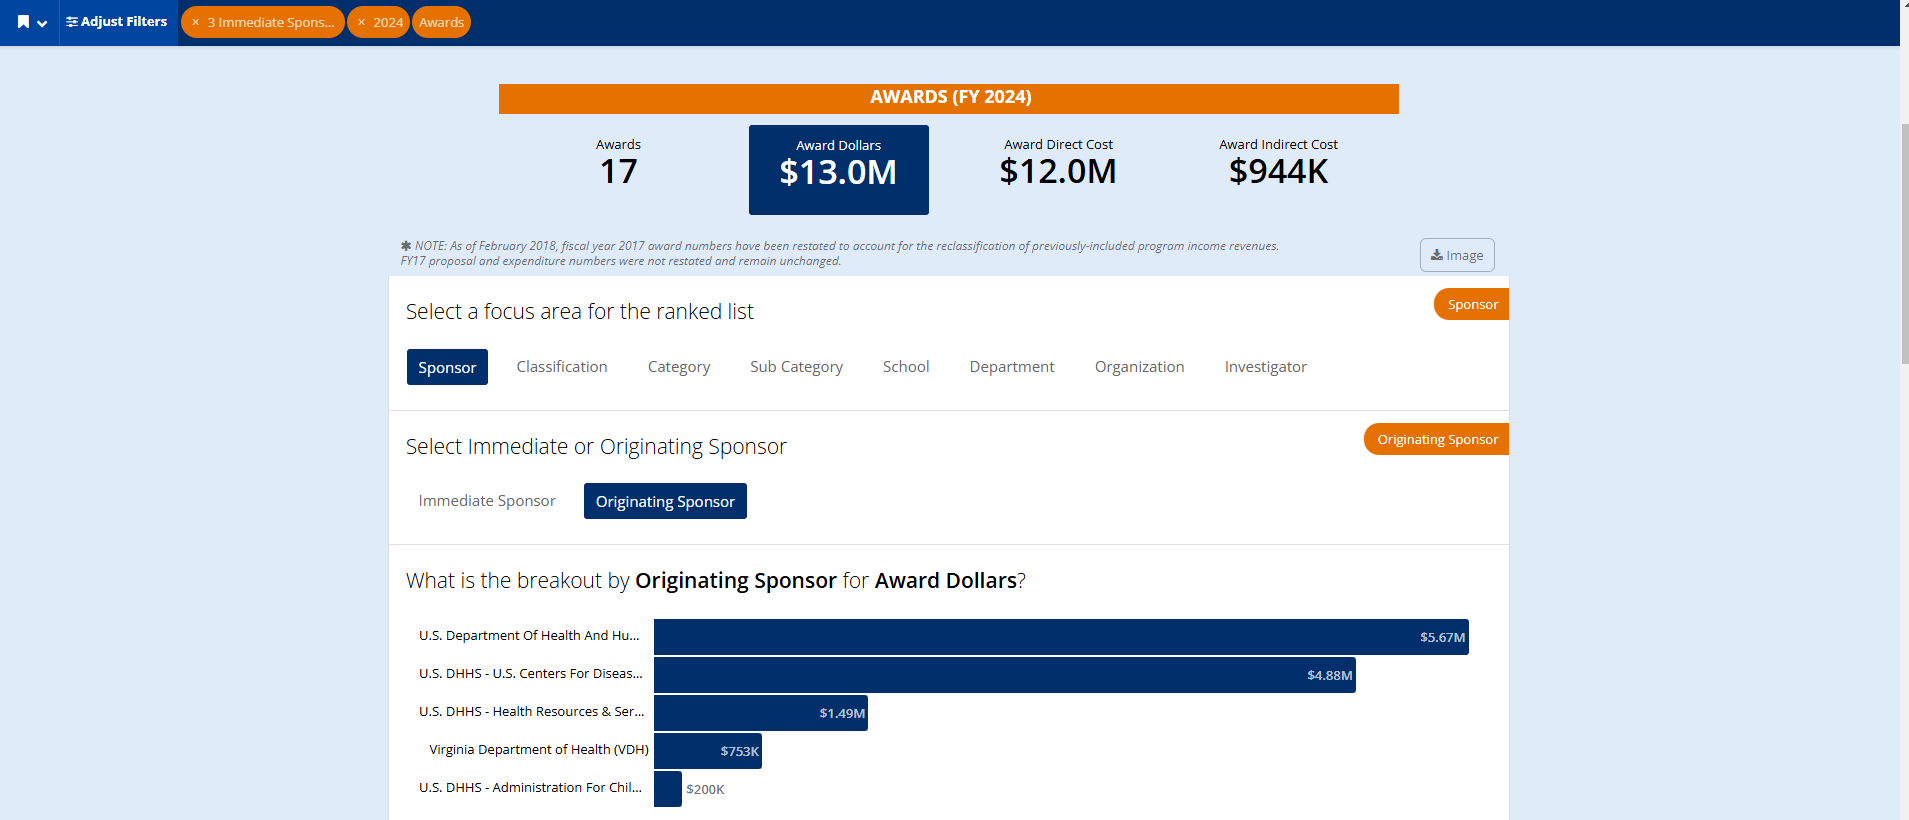
Program income has been removed from fiscal years 2016 and 2017 and award numbers have been restated to account for the reclassification of previously-included program income revenues. Program income will not be included from 2018 forward. Proposal and expenditure numbers were not restated and remain unchanged.
You can read more about using Juice in the Using ResearchUVA section. If you can't find what you're looking for there, email Ovpr-infoteam@virginia.edu, referencing Juice in the subject line.